Page 323 - ISES SWC50
P. 323
11.5 Solar Thermal 2010-2020

            Key points from the IEA SHC data:
            •  IEA SHC collected data from 63 countries and estimated that all other countries represented 5% total
               annual installed capacity.
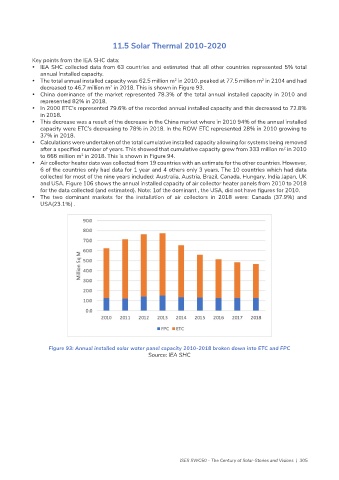
            •  The total annual installed capacity was 62.5 million m  in 2010, peaked at 77.5 million m  in 2104 and had
                                                                                             2
                                                              2
               decreased to 46.7 million m  in 2018. This is shown in Figure 93.
                                        2
            •  China dominance of the market represented 78.3% of the total annual installed capacity in 2010 and
               represented 82% in 2018.
            •  In 2000 ETC’s represented 79.6% of the recorded annual installed capacity and this decreased to 72.8%
               in 2018.
            •  This decrease was a result of the decrease in the China market where in 2010 94% of the annual installed
               capacity were ETC’s decreasing to 78% in 2018. In the ROW ETC represented 28% in 2010 growing to
               37% in 2018.
            •  Calculations were undertaken of the total cumulative installed capacity allowing for systems being removed
               after a specified number of years. This showed that cumulative capacity grew from 333 million m  in 2010
                                                                                                     2
               to 666 million m  in 2018. This is shown in Figure 94.
                              2
            •  Air collector heater data was collected from 19 countries with an estimate for the other countries. However,
               6 of the countries only had data for 1 year and 4 others only 3 years. The 10 countries which had data
               collected for most of the nine years included: Australia, Austria, Brazil, Canada, Hungary, India Japan, UK
               and USA. Figure 106 shows the annual installed capacity of air collector heater panels from 2010 to 2018
               for the data collected (and estimated). Note: 1of the dominant , the USA, did not have figures for 2010.
            •  The two dominant markets for the installation of air collectors in 2018 were: Canada (37.9%) and
               USA(23.1%) .


                  Figure 93: Annual installed solar water panel capacity 2010-2018 broken down into ETC and FPC
                                                     Source: IEA SHC


                                                                ISES SWC50 - The Century of Solar-Stories and Visions  |  305

