Page 346 - ISES SWC50
P. 346
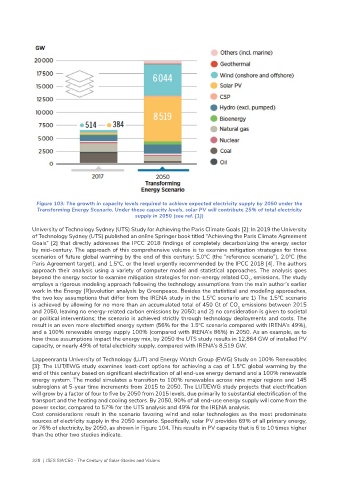
Figure 103: The growth in capacity levels required to achieve expected electricity supply by 2050 under the
              Transforming Energy Scenario. Under these capacity levels, solar PV will contribute 25% of total electricity
                                                supply in 2050 (see ref. [1])

            University of Technology Sydney (UTS) Study for Achieving the Paris Climate Goals [2]: In 2019 the University
            of Technology Sydney (UTS) published an online Springer book titled “Achieving the Paris Climate Agreement
            Goals” [2] that directly addresses the IPCC 2018 findings of completely decarbonizing the energy sector
            by mid-century. The approach of this comprehensive volume is to examine mitigation strategies for three
            scenarios of future global warming by the end of this century: 5.0ºC (the “reference scenario”), 2.0ºC (the
            Paris Agreement target), and 1.5ºC, or the level urgently recommended by the IPCC 2018 [4]. The authors
            approach their analysis using a variety of computer model and statistical approaches. The analysis goes
            beyond the energy sector to examine mitigation strategies for non-energy related CO , emissions. The study
                                                                                        2
            employs a rigorous modeling approach following the technology assumptions from the main author’s earlier
            work in the Energy [R]evolution analysis by Greenpeace. Besides the statistical and modeling approaches,
            the two key assumptions that differ from the IRENA study in the 1.5ºC scenario are 1) The 1.5ºC scenario
            is achieved by allowing for no more than an accumulated total of 450 Gt of CO  emissions between 2015
                                                                                     2
            and 2050, leaving no energy-related carbon emissions by 2050; and 2) no consideration is given to societal
            or political interventions; the scenario is achieved strictly through technology deployments and costs. The
            result is an even more electrified energy system (56% for the 1.5ºC scenario compared with IRENA’s 49%),
            and a 100% renewable energy supply 100% (compared with IRENA’s 86%) in 2050. As an example, as to
            how these assumptions impact the energy mix, by 2050 the UTS study results in 12,864 GW of installed PV
            capacity, or nearly 49% of total electricity supply, compared with IRENA’s 8,519 GW.

            Lappeenranta University of Technology (LUT) and Energy Watch Group (EWG) Study on 100% Renewables
            [3]: The LUT/EWG study examines least-cost options for achieving a cap of 1.5ºC global warming by the
            end of this century based on significant electrification of all end-use energy demand and a 100% renewable
            energy system. The model simulates a transition to 100% renewables across nine major regions and 145
            subregions at 5-year time increments from 2015 to 2050. The LUT/EWG study projects that electrification
            will grow by a factor of four to five by 2050 from 2015 levels, due primarily to substantial electrification of the
            transport and the heating and cooling sectors. By 2050, 90% of all end-use energy supply will come from the
            power sector, compared to 57% for the UTS analysis and 49% for the IRENA analysis.
            Cost considerations result in the scenario favoring wind and solar technologies as the most predominate
            sources of electricity supply in the 2050 scenario. Specifically, solar PV provides 69% of all primary energy,
            or 76% of electricity, by 2050, as shown in Figure 104. This results in PV capacity that is 6 to 10 times higher
            than the other two studies indicate.


            328  |  ISES SWC50 - The Century of Solar-Stories and Visions

